Process Analysis Tools
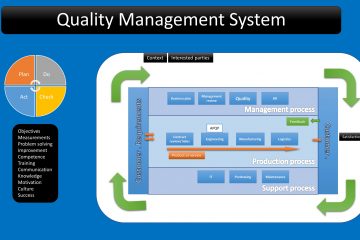
In this blog we have talked several times about Quality Management Systems and the famous process approach and risk-based-thinking. As you might remember, we started by describing the main business processes as the “add-value-stream”. But sometimes it is difficult to have an objective and abstract view of what a process is and its elements.
In industrial engineering there are many effective tools for the Work Analysis to understand the tasks to be done and the elements and factors that play an important role in whatever is that you want to analyze.
There are many different models like process flow, process charts, synoptic or analytic charts, motion study, time study, machine-man chart, etc. And of course in other disciplines you also have similar techniques like the Data analysis in IT.
In a Quality Management System we have also two simple but powerful tools that we can use for:
- Process mapping.
- Process analysis.
- Risk analysis.
- Audits – system and process.
And these are the SIPOC and the turtle. Of course you can use any tool that you consider adequate for you and your company. I could, as an engineer, recommend using the industrial engineering tools for all manufacturing-related processes but the decision is yours and it will depend on the scope of your analysis and your needs.
Since in a QMS there are more business processes than the manufacturing ones, the SIPOC and the turtle are great because they are simple and easy to use.
Process approach.
We have covered this before but as a little reminder: Process is a set of activities to transform inputs into outputs.
Black box
We can always start the analysis by considering the process as a black box. We might not know exactly how it works inside but, we may know what we need to feed in and what we can expect as result.
We can do this with one isolated process or for the complete organization.

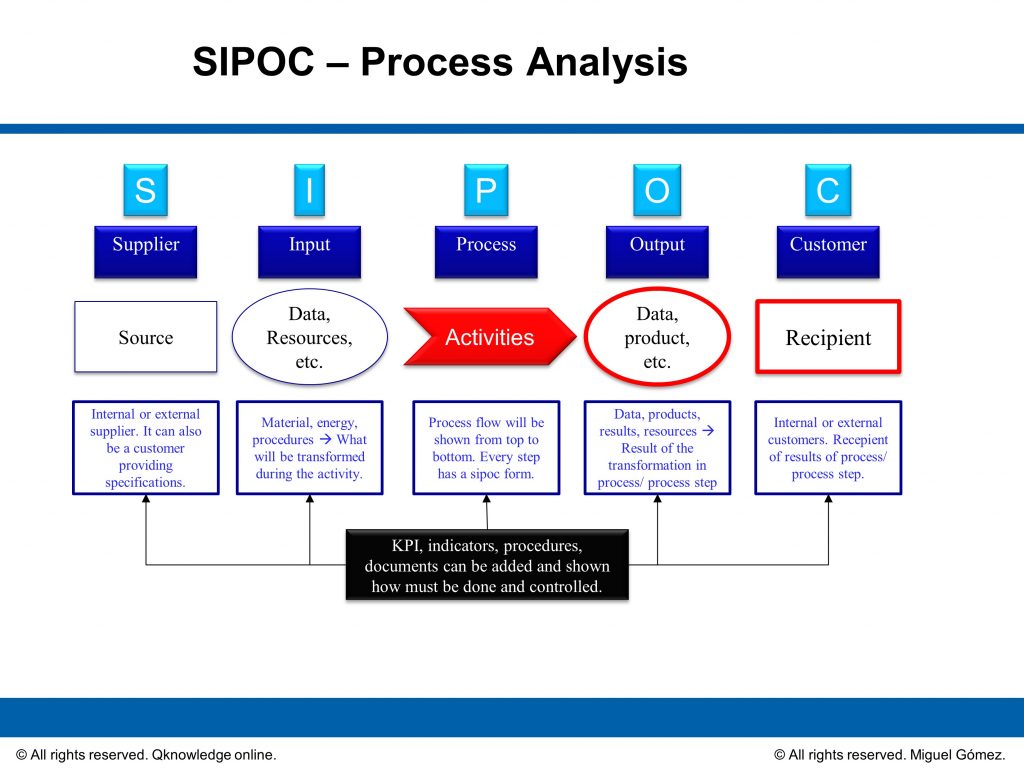
SIPOC = Supplier-input-process-output-customer
 A second step is to go a little beyond and consider all the inputs needed. Where do they come from?
And then consider the outputs. What are the expected results? How many/much? For whom? when?
Once we have a better view, we can split the process in operations, activities or steps and consider a sipoc for every one of them if needed.

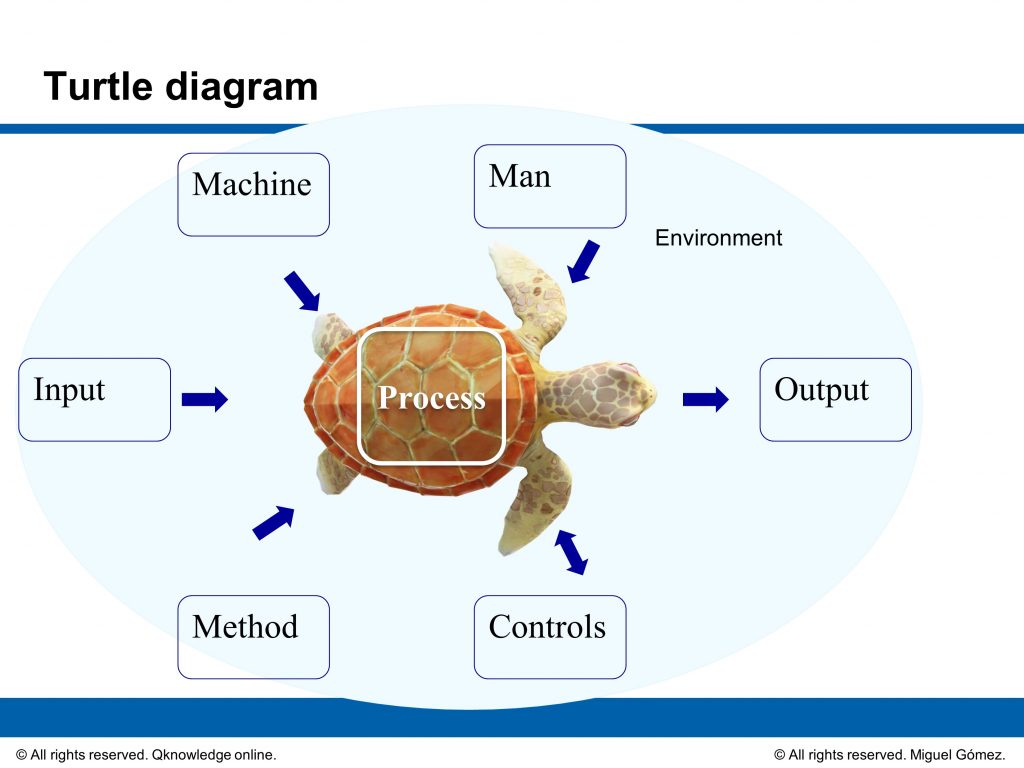
 The turtle analysis is a great tool to go deeper in a process or process step and consider not only inputs and outputs but the environment and other elements or factors that can affect the process performance and its end result.
Some people say that Phillip Crosby was the creator of the turtle “scheme” by integrating more elements to the sipoc and defining the interactions among them.
I can only say that the turtle is far more than a diagram. It is a graphic way to visualize details in an organized form. I think of it as the “Ishikawa” diagram but used in process analysis.
Elements
The turtle I use, has the following elements:
- The overall process description or the body.
- The inputs and outputs as head and tail.
- The resources needed. On the top right side you will see the human resources. On the top left side you record all others like equipment, tools, etc.
- Working methods, standards, procedures are recorded on the bottom left part.
- Controls and indicators on the bottom right. Numbers from 3-5 are the legs of the turtle.
 Use
UseThe turtle can be used for:
- Describing a business process of the QMS.
- Analyzing a manufacturing process.
- As a form to record audit evidence. I use it for system and process audits.
- As tool for the risk analysis in every business process.
- As graphic aid when preparing the PFMEA.
You can take a look and download these files:

0 Comments