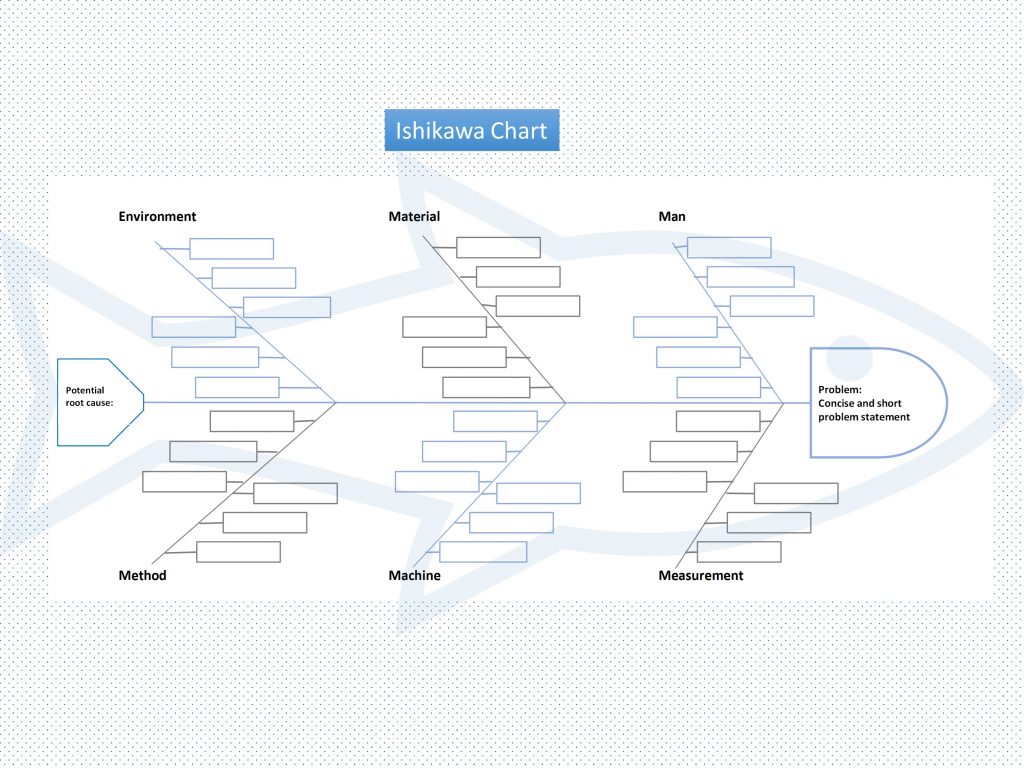
Ishikawa diagram, fish bone or cause-effect chart.
Ishikawa or fish bone diagram is a tool that can be useful to find the root cause or causes for a certain problem. It can be used once you have defined and stated the problem.
As we have discussed in other posts (8D and Is – is not) there are many useful quality-tools for problem solving but some of them are to be used only in certain phases of the process. Techniques like is / is-not and brain storming can be used to understand the situations, claim or failure report and to define and clearly state the problem. As next step, you can use the Ishikawa or fish-bone diagram to visually display and define ALL the potential root causes of the problem. Those possible causes will be grouped in categories called 5M + E.
So, the Ishikawa is a graphic analysis tool where the fish skeleton starts from the head and goes through the tail showing the problem and all potential causes. This means that the head can be drawn and populated only when you know what the problem is. Then you will add to the skeleton the rest of the structure in these main categories:
- Man. You will record here all possible causes related to people, behavior, knowledge, operator skills and abilities, etc.
- Machine. Manufacturing assets, lines, machines, tools, parameters, operation, programs, maintenance, performance and related causes will be listed here.
- Method. Instructions, workflows, standard work activities and other operation guidelines shall be included here.
- Measurement. Measuring devices, controlling and testing means for product or processes and their characteristics should be included here.
- Material. Components, raw materials and other elements which are used, added, modified, assembled and processed are to be listed in this category.
- Environment. Illumination, working or operation conditions like humidity, temperature, noise, vibrations and any other element of the “surroundings” which are suspected to be the cause or be related to the cause should be considered here.
Under the category “environment” you can consider as well, depending on the problem, root causes which cannot be related to other categories or, you can create additional branches and categories as required.
I personally have used other categories instead of environment, for example “design” when causes were related to the original definition of the part, functionality, tolerancing, reliability, etc. And I also take the most probable cause and write it again in the tail area….
Please keep in mind that the Ishikawa is “only” a tool, and its use depends on you. You can adapt it to your own and specific needs.
How does it work?
- Whenever possible, organize and define a team of experts from different areas who may contribute in the solving process (multidisciplinary). The members should be somehow related to the problem, its consequences and/ or the manufacturing or business/operation processes where the problem appeared.
- Use an Ishikawa form in excel (Ishikawa_Diagram), pdf or draw it in paper or on the board. If you decide to draw your own version, make sure you have enough space for the head and the vertical (diagonal) lines for the categories.
- Enter the problem statement in the “head” area.
- Draw the lines for the categories 5M+ E or what suits your purposes.
- Go to the first category and write all the possible root causes of the problem that could be classified in this category. Consider every factor regardless of the likelihood of occurrence or probability.
- Repeat the step 5 for all other categories (5M+E).
- Once all categories are populated, identify the cause or causes that seem to be the “real” root cause.
Take a look to data, records, FMEA or other tools to assess the likelihood of the causes. There may be a “unique” root cause, but could also be a combination of “partial” root causes which “trigger” the problem when they appear simultaneously or in a defined sequence.
To better understand the case of multiple or partial causes, think of the “ingredients” of an accident which appear either simultaneously or in a certain sequence:
-
- A dangerous activity,
- A distraction of the operator or user,
- An error or mistake.
Root cause verification
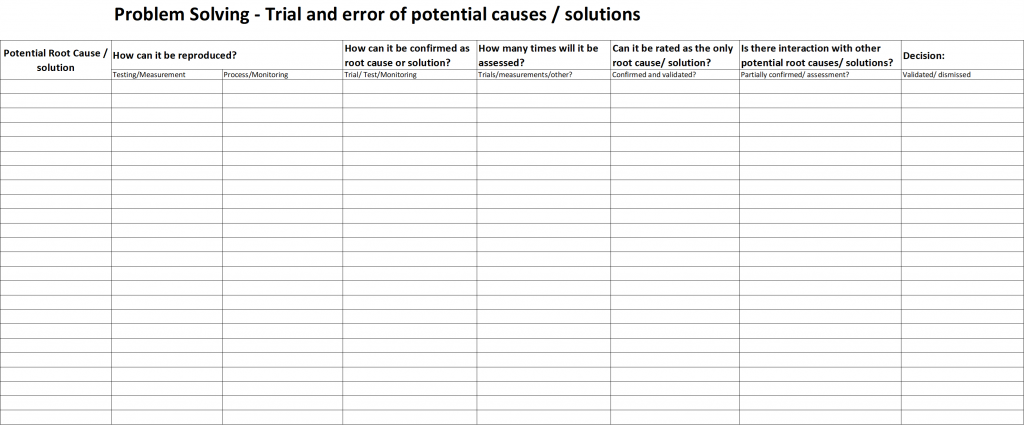
The ishikawa diagram is complete when all potential causes have been identified and populated in the form. However, as discussed in the 8D, the causes should be rated and confirmed whenever possible and prior to proposing solutions. I have used for some cases a “trial and error” matrix as an additional tool. You can download it here TrialAndError or take a look to the image below.
I wish you a lot of success!
Miguel

0 Comments