GR&R - variables
Hi, i’m glad you’re here. This is the right place to get some hints on the GR&R, see how it works, how to improve results, calculation options and of course, you can get a free excel sheet to perform and record your analysis.
MSA
The GR&R is one of the MSA techniques available to assess how well a measurement system works and how reliable it is. I will not describe here details on the MSA nor the techniques you but focus only on the GR&R. If needed, you can read the details here “MSA Explained”.
However, i will stress a little the overall purpose of any and all of the MSA techniques:
to prove:
- how adequate the device(s) and/or system(s) is/are for the intended purpose,
- its resolution compared to the units and tolerances to measure (requirements),
- how “accurate” it measures. Bias is the parameter for that and basically is the “gap” between a known reference value (master calibrated and traceable block vs. the values measured with the device/ system
- how the bias varies along the measurement range (linearity) or
- how the bias varies in a certain period of time (stability)
- that the values obtained are repeatable and reproducible (R&R) when used by different people (of course trained and skilled)
- that the measurement uncertainty of the device and system is acceptable
and all of these “checks” with the final goal to validate a measuring system which provides reliable information to enable you to judge whether the parts or products measured are good or bad. The better the system, the lower the probability to make one of two errors:
- scrap good parts (when the system mistakenly says “the parts are bad”).
- deliver bad parts to the customer (when the system mistakenly says “the parts are good”).
GR&R
The gage R&R (repeatability and reproducibility) has the objective (as any other MSA technique) to prove that the system can “identify” BAD PARTS and provide results which are repeatable and reproducible.
As a reminder:
Repeatability is the ability of the system to provide very similar values/results when the very same part is measured several times (so the values “repeat themselves”)
Reproducibility is the ability of the system to provide very similar results when the same part is measured by different appraisers ( so the values get “reproduced”.
Note: The objective is NOT to show production process CAPABILITY and therefore, the parts to measure in the GR&R analysis must be ALL different and when possible not only cover the complete measuring range but include parts out of the specification in BOTH directions, “smaller” than the lower tolerance and “bigger” than the upper tolerance.
This is because we need to “challenge” the measurement system and “assess” its ability to CATCH all the bad parts AND repeat and reproduce results in the whole range of interest (either the production variation or the tolerance range).
GR&R ingredients
There are at least two traditional methods to perform the gr&r, the American (as per the AIAG) and the German (as per the VDA Band 5). The main differences are:
- the number of appraisers
- the number of trials
- the calculation method (but both can be made with anova)
But in general, the following recipe is accepted by most of the customers globally:
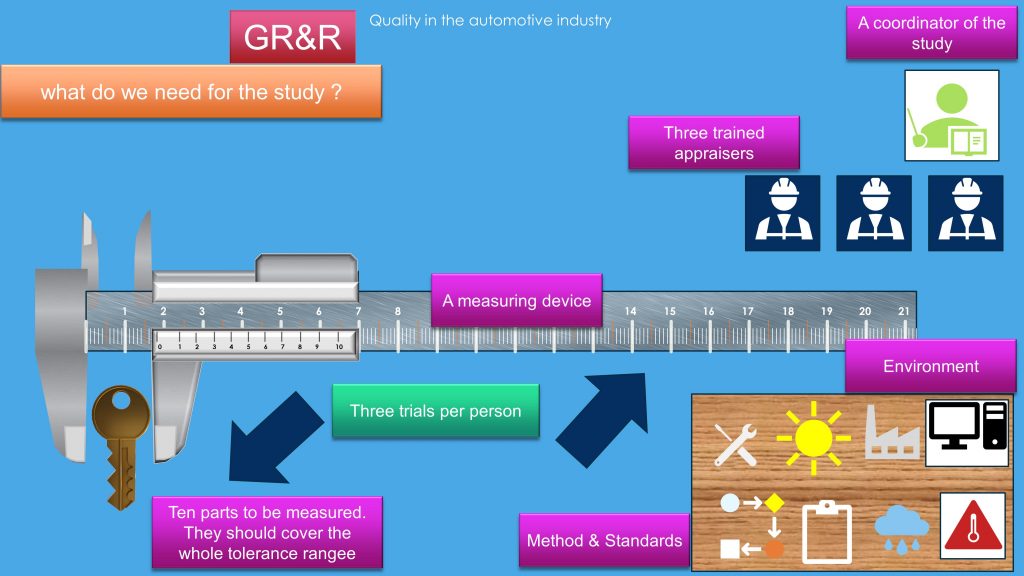
Ingredients:
- Ten parts. The coordinator of the study needs to select them (or have them produced as special “request”), mark them in such a way that only he can tell which part is which, measured them as accurate as possible and record the reference value of each.
- Three appraisers. They have to be skilled and trained in the use of the measurement system, use exactly the same method and the same elements (jigs, fixtures, measuring system, conditions (temperature, humidity, illumination, etc.).
- One coordinator. As mentioned in 1) he will organize the study, pre-select the parts, record the values of each part and have one appraiser at the time measure all the parts.
- Three trials. One trial refers to having one appraiser measure all ten parts while the coordinator records accurately the measured values. Ideally he will go 1 round with every appraiser, then a second time and at the end the third time. This is to prevent the operators “recognizing” the parts and “remembering” the measured values. We are human and the appraisers may feel under pressure as though they needed to obtain exactly the same measured values for all different parts.
- One measurement system. The system is not only the measuring device but also the method, jigs, tables, environment (like a laboratory or production area), procedures, calibration (zero setting), etc. The system should remain exactly the same for all three appraisers and all trials.
Calculation options
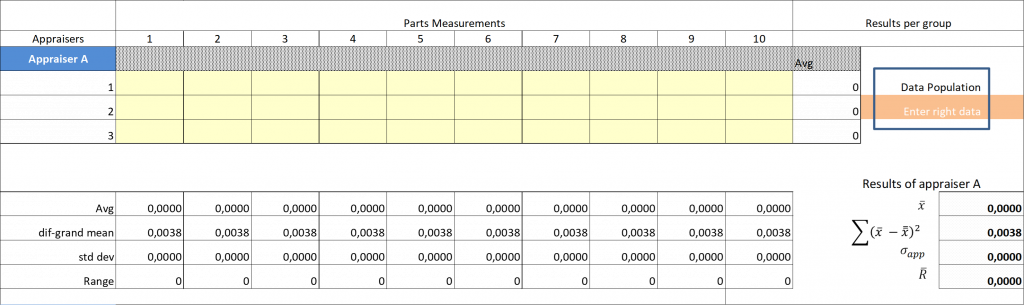
Regardless of the calculation method, you should first organize the data so that the calculations can be, later on, easily made. For example, you need to build a matrix for every appraiser with his results of every part measured and every trial. For example:
The calculations methods you can use are:
- Average and range with parts total variation.
- Averange and range with tolerances of a reference product (i.e. customer requirement).
- Anova with/ without interaction with parts total variation.Anova with/ without interaction with tolerances of a reference product.
The calculation method is the mathematical process to “treat” the information you gathered from all appraisers, parts and trials.
Averange and range is the first proposed method as per the AIAG MSA manual. Anova is the an option to perform the analysis of variance as a statistical tool.
The parts total variation refers to the whole range of values for all parts measured, from the smallest to the biggest. I personally like using this because it “represents” the production reality. The values within this range represent the total variation in the whole manufacturing process.
For customers who require the MSA as per AIAG you may want to consider the tolerances of the product (and related measured characteristic or feature) as stated in the drawing.
I will, once more, restate that: the MSA is not related to the production process capability but to the ability of the measurement system to provide reliable information about the “state” and “quality” of the measured parts, so we can decide whether they are good or bad. In my personal opinion, we should not limit the ability of the system to “look for” what was specified in the drawing but consider as well all the parts which “production” will produce.
Why should we consider all of those? Because we need to guarantee conformity of all manufactured and assembled products…. and …. we need to use the measuring system not only in the tolerance range of the product but on all products obtained from the manufacturing process. The measurement system should be CAPABLE to provide reliable measurements/ data to let us decide whether the product is “good or bad”.
Understanding the elements of the analysis
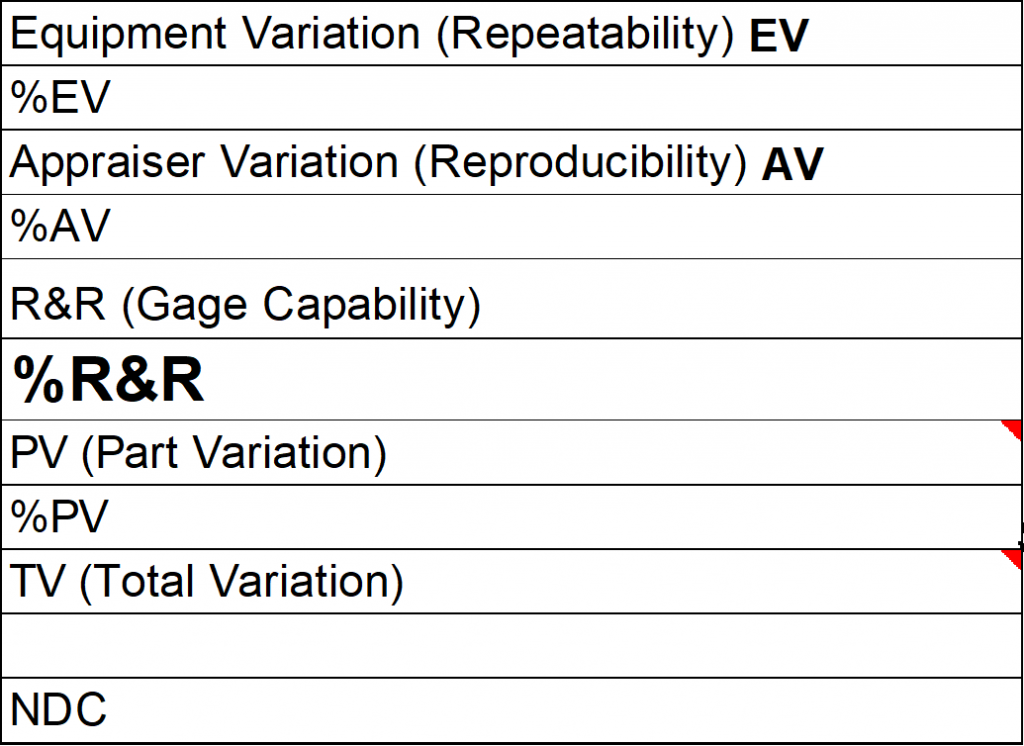
Regardless of the calculations method you use ( which by the way may generate different results – perhaps better or worse depending on pars, data, method, tolerances, etc. ) you will obtain the following basic elements of the GR&R:
Now you may want to know what the elements mean…. so, let’s see:
- As mentioned above, the repeatability is the ability to obtain the same or very similar data when you measured the same object several times with the same system. So, the EV is the equipment variation that shows you the degree in which every appraiser was able to obtain or not the same result when measuring the same part three times. The final value of the EV considers already every measurement of all appraisers in all trials and parts. However, you can also take a look to the part 1 for instance and results for every individual appraiser and trial. If the values vary a lot even for the same appraiser, the system might not be as good as expected…. but it is not the only parameter to consider.
- AV is the appraiser variation or an indicator on how close the measurement of individual parts (when measured by different appraisers) were. You can take a look of the average measurement of individual parts of every appraiser and compare to the others. If the difference is big, the AV value will be big as well.
- NDC is the number of different classes. If the parts are very similar to each other, the NDC will be small. The NDC is like sorting the parts measurements in a histogram…. if the parts are to similar, they will be grouped together and this “column” of the histogram will be considered 1 class. If all parts together can “only” be classified in less than 4 categories (classes) means that the parts are too alike and may not cover the complete tolerance range/ variation range, etc. As per the AIAG MSA manual, it should be equal or greater than 5.
- PV is the part variation. It is an indicator of the minimum and maximum value (as range) obtained of all parts measured in all trials and by all appraisers. It shows the degree of values variation for individual parts when measured by the same appraiser and different appraisers.
- TV is the total variation. It is an indicator of the total value range from the “smallest” value obtained in the study to the “biggest” considering all parts, trials and appraisers.
- R&R is the repeatability and reproducibility index. It is a resultant “vector” from the AV and EV components. It is the final indicator of the analysis when compared to the total variation or total tolerance range.
Acceptance criteria
In general, as per the AIAG MSA manual guidelines, the R&R index should be rated as follows:
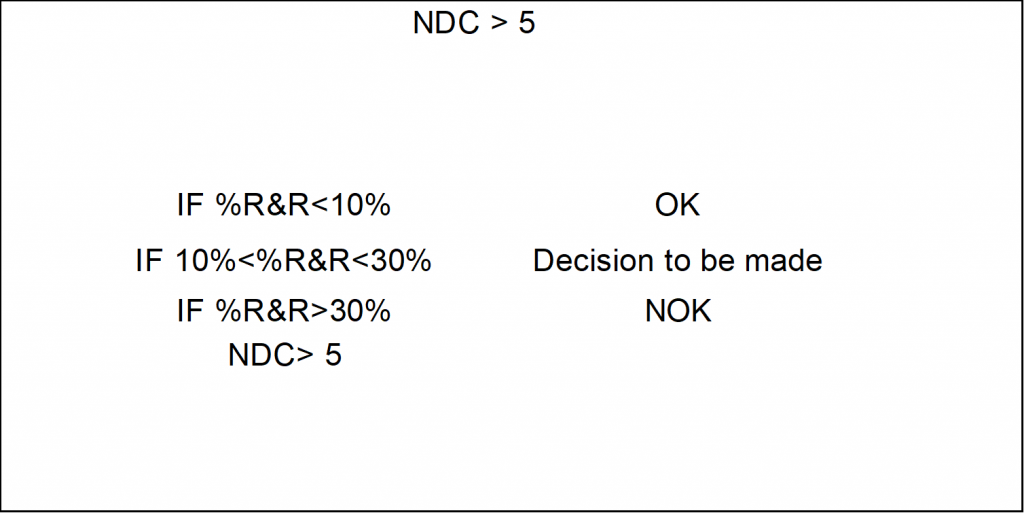
The decision to say: “the measurement system” is good or bad is based on the NDC and R&R final value. The %R&R means how much the “real” measurements vary between pieces and appraisers or, repeatability and reproducibility. If the variation is only 10% or lower, the system is reliable. If the %R&R is between 10% and 30% you may want to “evaluate” the results first and whether you can improve the results with a “better” part-selection or with a “better” method (training all appraisers to measure alike). It is believed that new measurement systems should never exceed 15% or 20% and for carry-over parts and processes the customer may accept up to 30% since the gages, devices and fixtures may be worn out and affect the performance of the system. In either case you may need to get approval from your customer.
Values of %R&R greater than 30% mean that the results as EV and AV vary so much that the system may not “catch” what good or bad is. So, values over 30% are NEVER acceptable.
Before you get rid of the “bad” measuring system, it is important to know:
- If the NDC is lower than 5, the parts were to “perfect” and in a histogram…. they could have been grouped only in 4 classes. So, select parts that are “less” perfect or “similar” to each other. If necessary, let production make parts that – indeed- cover the complete tolerance range and beyond. You cannot make any decision about the quality of the measuring system if the NDC is lower than 5.
- If the EV and/AV is very different for every appraiser, you may want to “train” them on the right method and procedure to use the device/ system and how to measure the part. If the appraisers change the method every now and then, the datum of the part, etc. the results will vary not because of the quality of the device but because of the method which may not be considered as “standard method”.
- If the EV is good for individual appraisers but the AV kicks the R&R value out of scope… the appraisers measure in a different way… they may be able to “repeat” the values but because differences in skills, set up, method, etc. they might have differences which lead to different results.
Are you ready now to go for a GR&R analysis?
The traditional GR&R form looks like this:
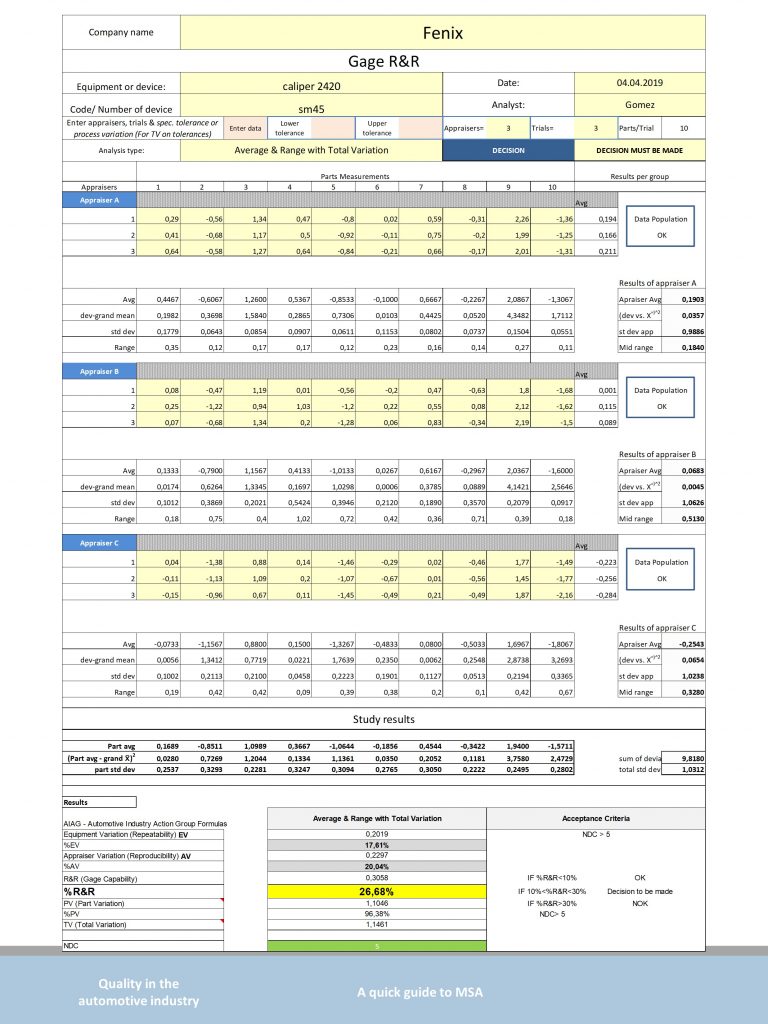
Calculation sheet
If you are looking for an easy way to perform your GR&R study and need an excel calculation sheet, please feel free to use this link and use a free form from “Quality in the automotive industry” here.
You will have several options for the calculation from averange and range through anova.
I wish you a lot of success!!!!!
Miguel

0 Comments