What is the repeatability analysis?
In the measurement system analysis MSA, the repeatability is the ability of a measurement system to provide similar (or very close) results when the same part is measured several times with the same gage and by the same appraiser.
If we had a measurement device that provides different values every time we use it, we could not use it as a reference. The idea of a measurement is to acquire a value, to define a magnitude for a characteristic being measured. This value, based on a standard, should provide reliable information to decide whether the characteristic measured can be judged as good or bad.
The repeatability analysis is a technique which helps assess the quality of a measurement system by defining the degree of repeatability. It is also known as “bias analysis” or “method 1” (VDA Band 5).
Before we see the calculation method, i would like to explain what accuracy and precision mean in this context and what role they play in this analysis.
What is accuracy? What is precision? Do they affect the repeatability?
Accuracy is the proximity of a measurement or the average of several measurements to the reference value.
Precision is the proximity between/among measurements when the standard is measured. It can be understood as the “closeness” or “similarity” among all the measurements.
And certainly both have an impact on the repeatability.
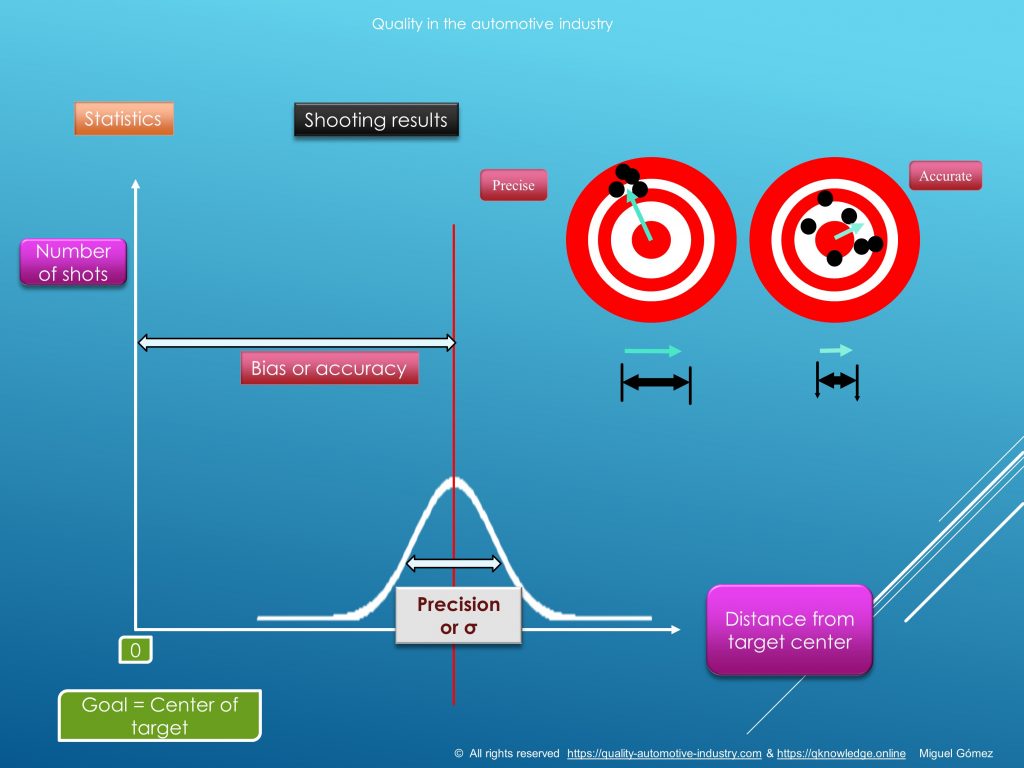
Precision would be our ability to shoot several times and have similar or identical results regardless on how far from the center the shots are.
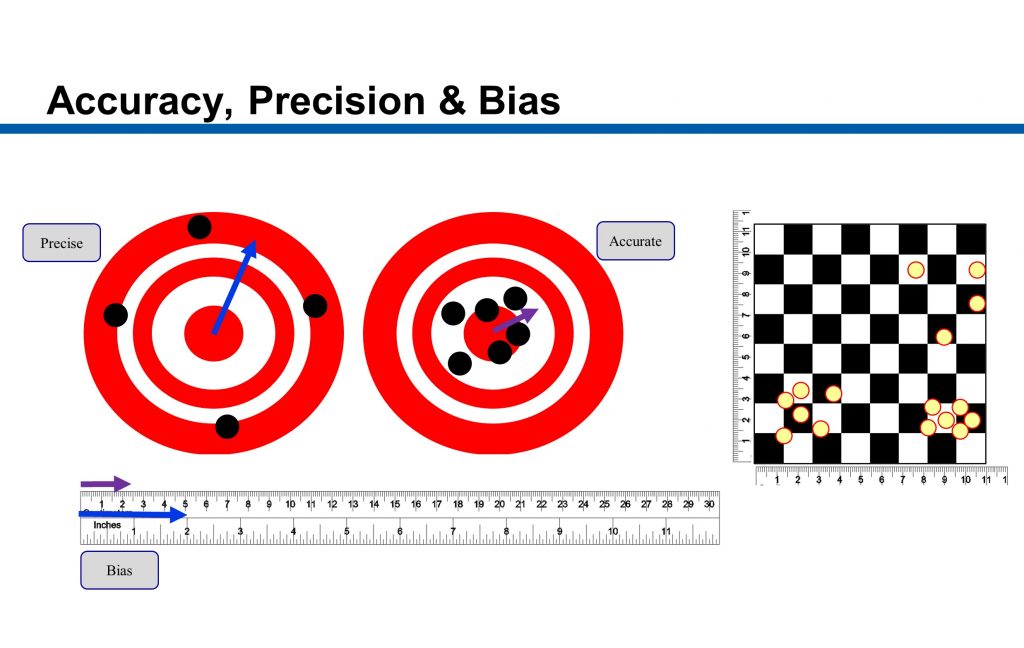
If we imagine that the chess board was also used as target and three persons shot (as small clouds of shots), what could we say about their accuracy and precision? if they wanted to hit on the left lower black square, who was the most accurate and who was the most precise?
The typical way to describe accuracy and precision is with a target for a shooting practice. If the center is the goal, we can assess how accurate we shoot based on the position of the shot in the target and its distance to the very center. If we perfectly hit the center, we are accurate, if we don’t, we can still measure and state how far it was.
On the image you can see the right target and the shots. The right shooter was more accurate than the left. But the left shooter kept in 4 shots the same distance to the center. If he was aiming for the outer ring… we was accurate and precise!!!!
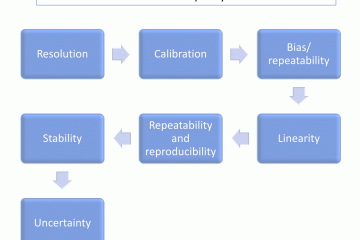
Repeatability analysis.
The MSA has two main techniques for the repeatability analysis. The AIAG (Automotive industry action group) model is called “bias analysis” and the VDA (Verband der Automobilindustrie) model is called method 1 (Verfahren 1). In principle the procedure is the same but the assessment method varies a little.
Bias is the “difference” or “distance” between the observed measurement and the standard (or reference value) or between the average value of all measurements and the standard. So, the bias is the value to measure how accurate the system is.
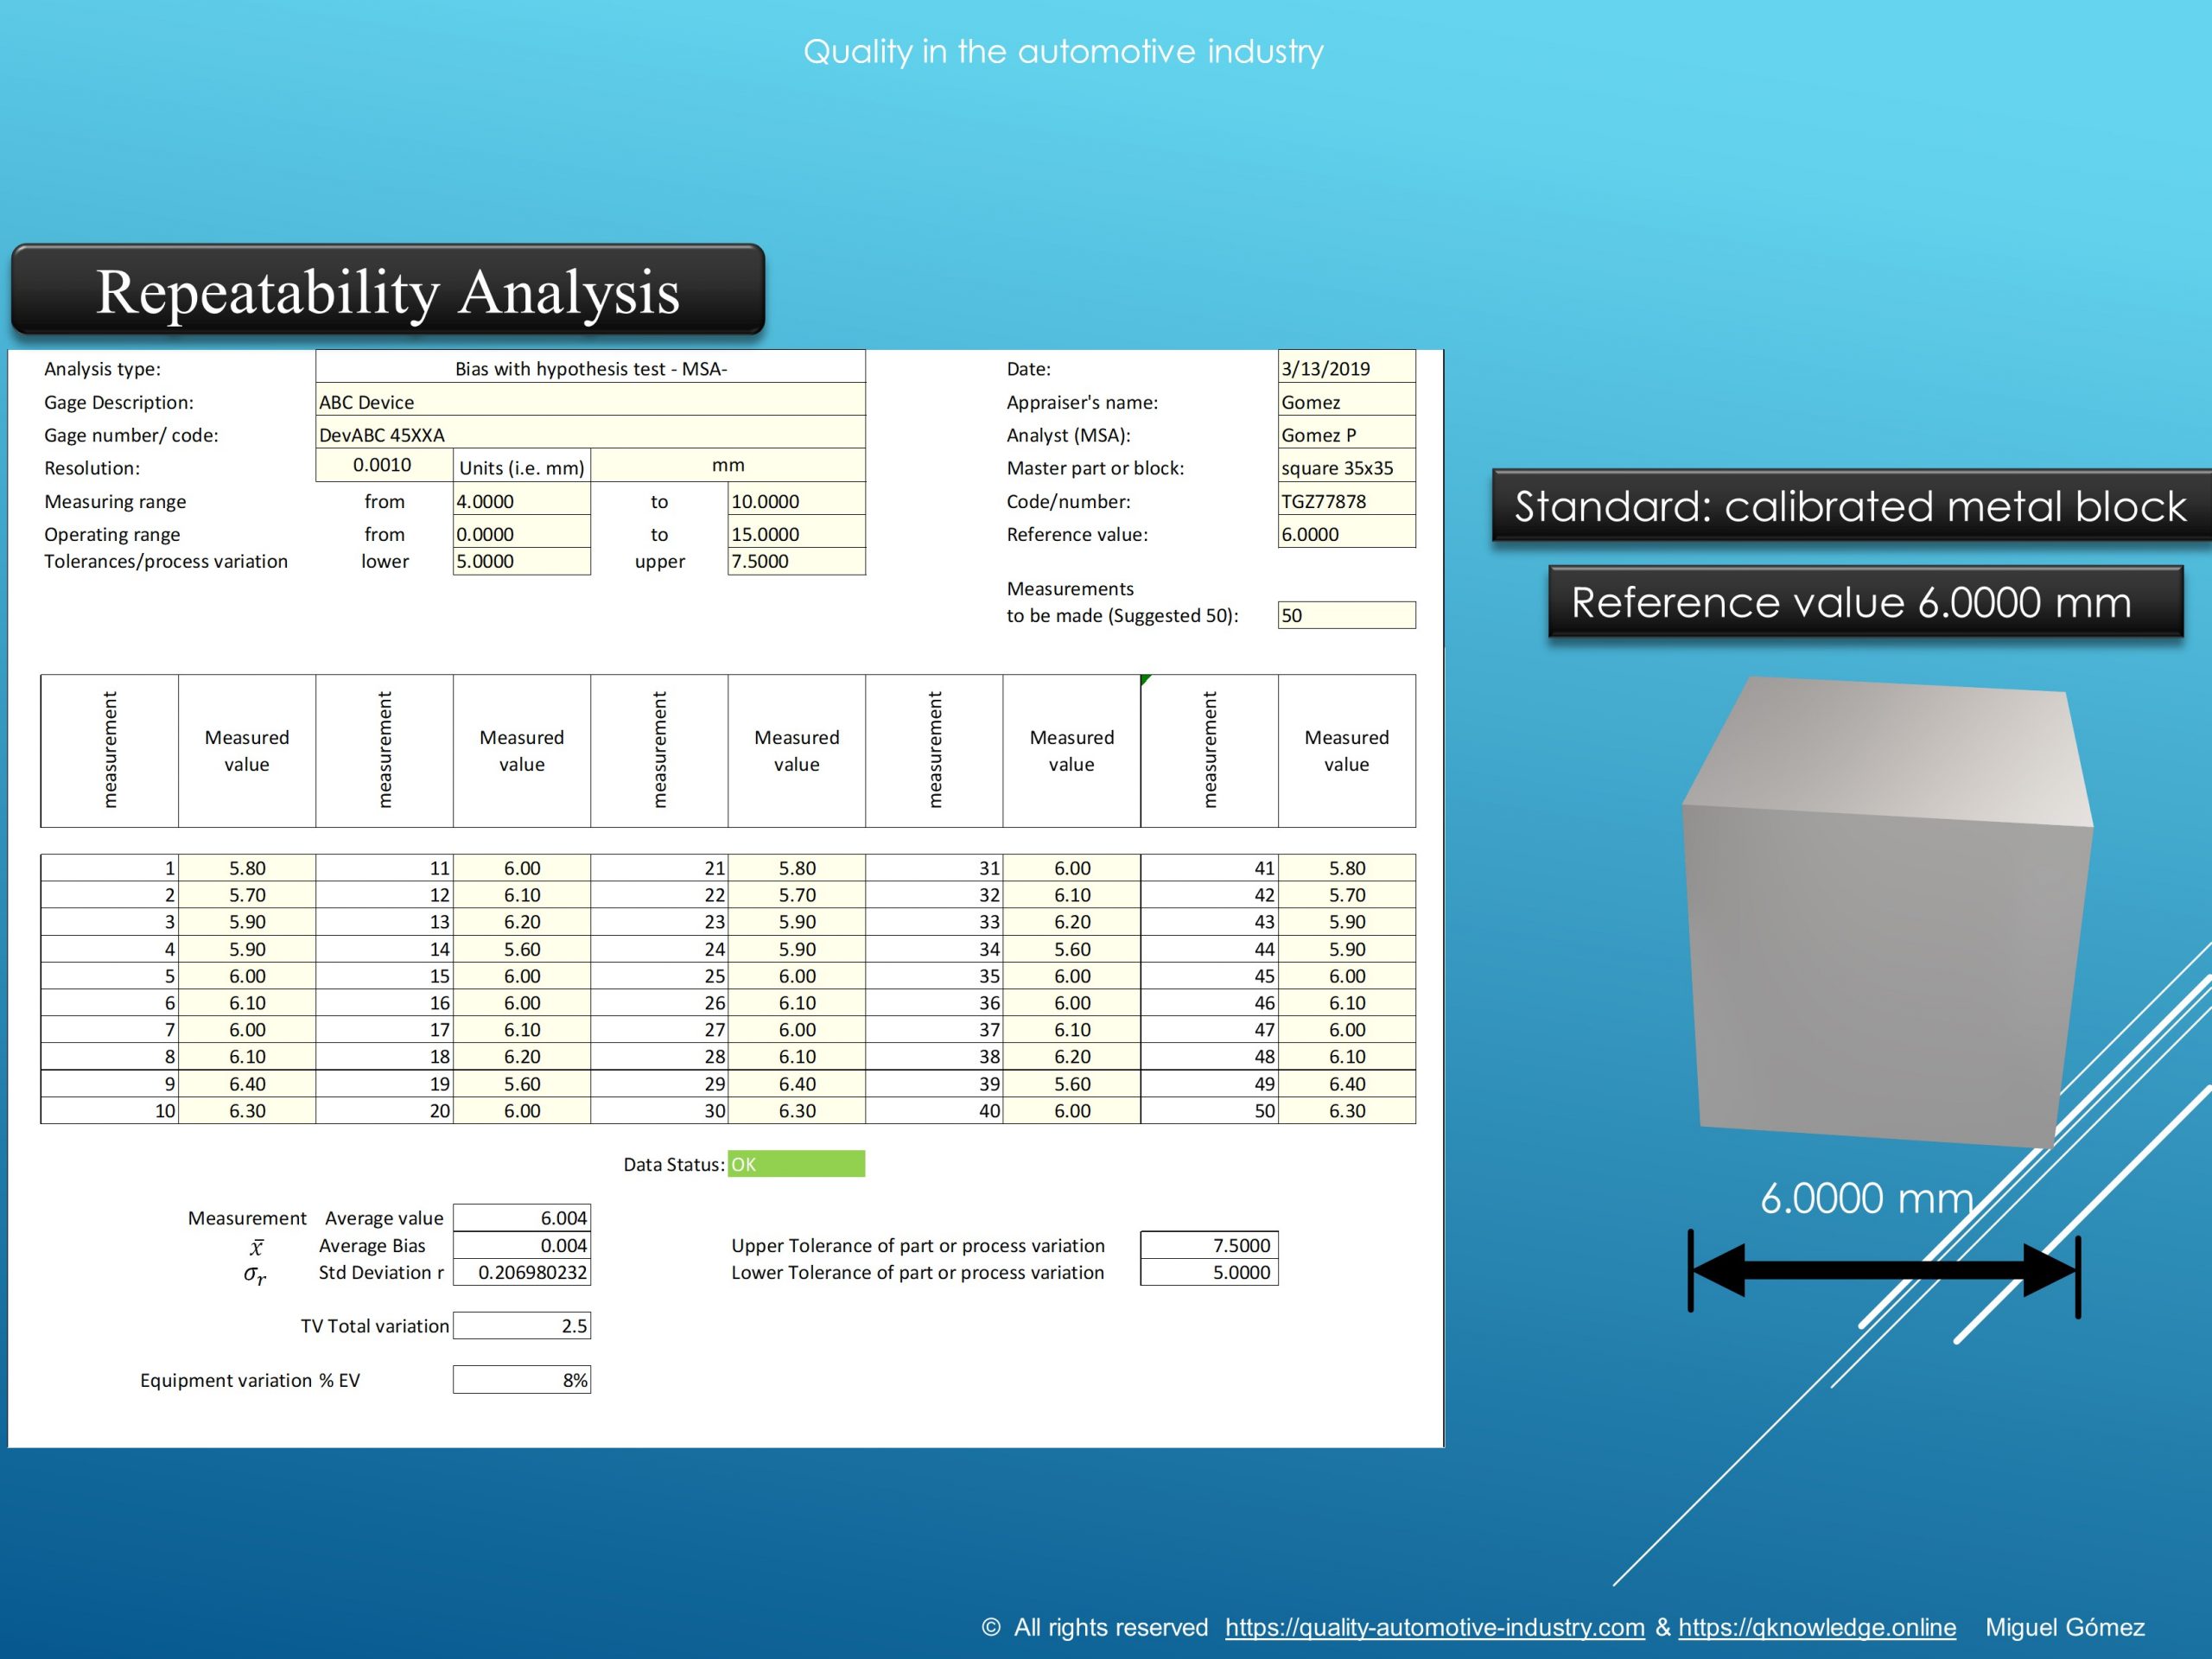
The analysis is made with one measurement system at a time. This means, one gage, one part (master or reference), one appraiser, one standard method and in an environment where the conditions cannot adversely affect the measurement. As the name says, the appraiser will measure the reference part several times and record all results. Afterwards, the analyst makes the calculations and can judge whether the system fulfills the repeatability requirement or not.
The master or reference part is a calibrated sample with known value and normally is measured by experts, a laboratory or a recognized institution. The difference between the average value of all measurements and the known calibrated value is the bias.
The analysis is made with the statistically. Average value, bias and standard deviation are used for the calculation.
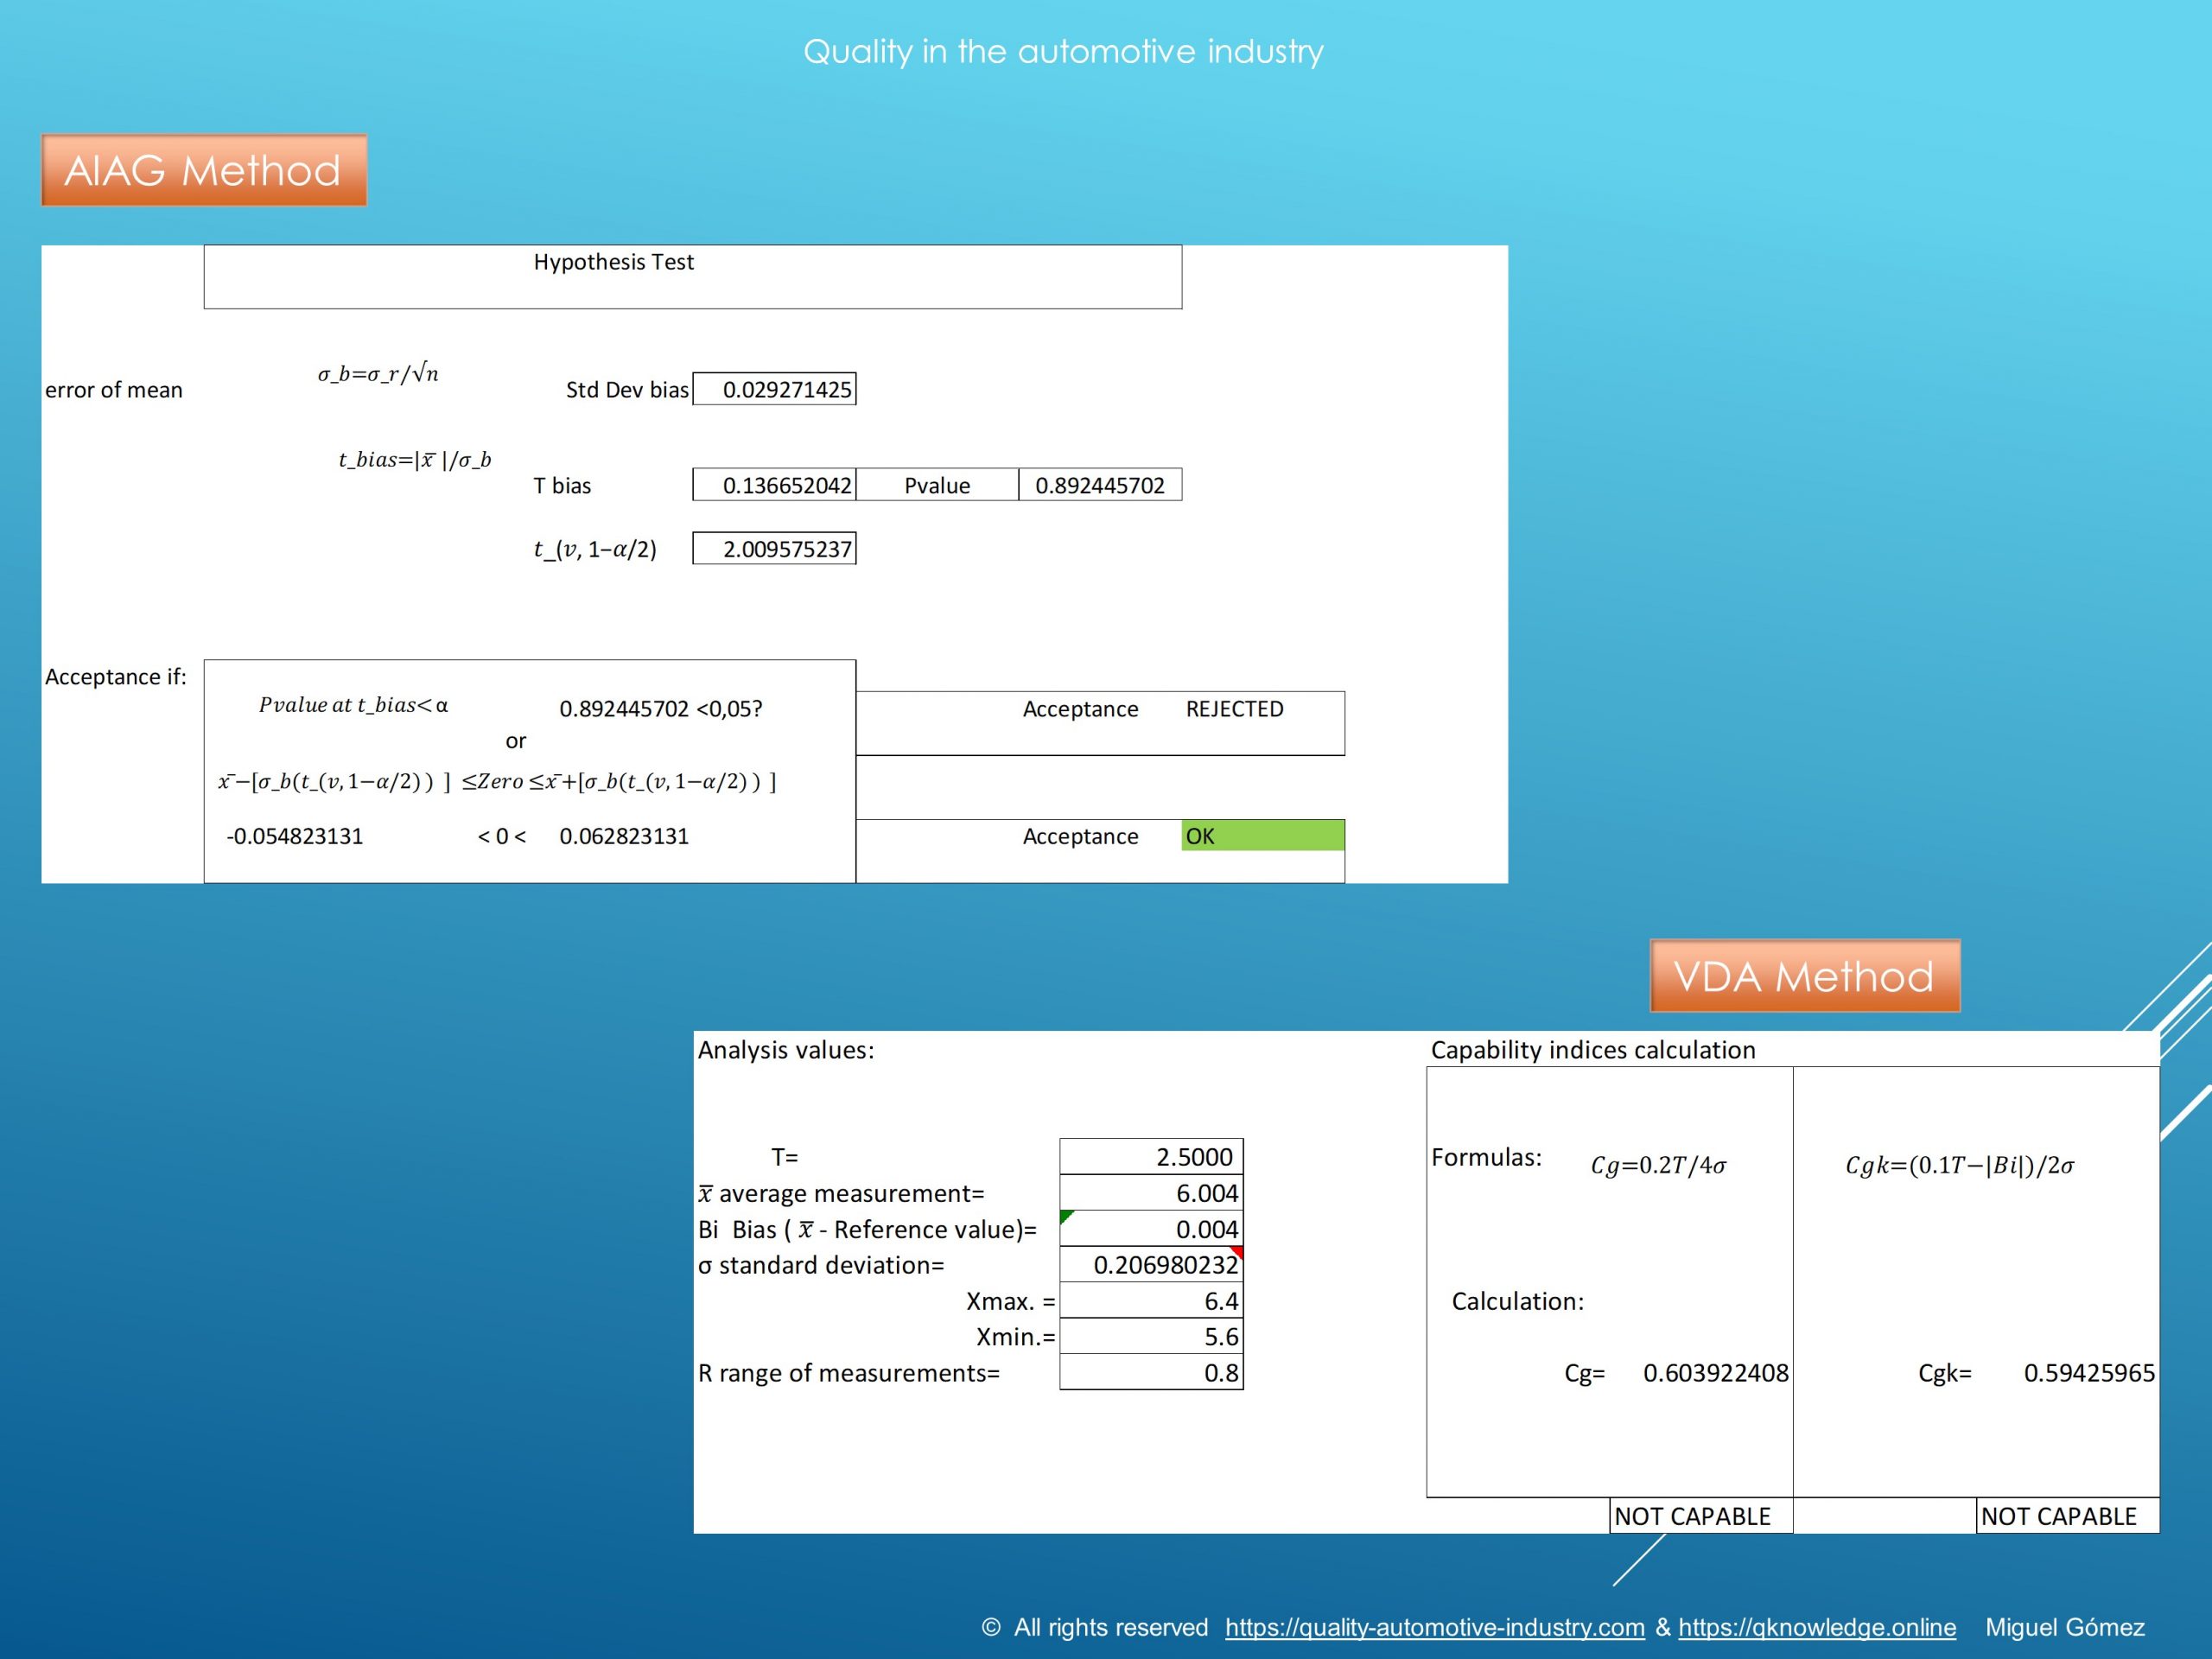
AIAG Method
The aiag method is based on a hypothesis test using the T distribution and the calculated P value. Please note that you can define the confidence level you want but 95% is recommended. The repeatability is good if the condition of the hypothesis is accepted.
VDA Method
The vda method uses a capability index called Cg and the math is similar to the cpk calculation, based either on the tolerance range or the total variation.


If you need some more details on the process itself, you can take a look at the post “accuracy and precision“.
Calculation forms
The math calculation is important if you don’t have MSA software. I made my own excel files with the formula. If you want, select the model you want and feel free to use the excel sheet.
The procedures easily explained
Procedure
If you use the AIAG MSA study type, you should measure at least 15 times. If you use the VDA method 1 (Verfahren 1) you should measure at least 25 times. I personally use 25 or 50 measurements.
The results are to be recorded like in the image below.
Analysis of results
If you use the AIAG study type, you will have to calculate the equipment variation EV and make a hypothesis test.
If you use the VDA method, you will calculate the standard variation and obtain the capability index Cg and Cgk.
As you can see, the methods are different. The hypothesis test gives you information about the distribution of the measurements and the probability to have similar parameters of standard deviation and average values when you measure again with this system if the Bias remains the same. It uses the t test and being a probability test, it is based on an expected confidence level, for example 95%.
The VDA method uses the Bias, standard deviation and either the process or the product tolerances to calculate the capability (similar to the calculation of the process capability Cpk).

0 Comments